Tip Off

What’s your number?
Did you know?
Did you know that players in the NBA are allowed to choose their own jersey numbers?
Players may choose numbers that have a specific meaning to them, like birthdays or an anniversary. They are allowed to choose one or two-digit numbers no greater than 99, and player position does not limit their choice.
If a player wants to change their number, they need to ask permission from their team and the league office.
Source:
Farrugia, S. (2023, September 12). NBA Jersey Number Rules: History, Regulations & More. Field Insider. https://fieldinsider.com/nba-jersey-number-rules-positions-and-numbers/#The_History_Of_NBA_Jersey_Numbers
Are you ready to learn about how we can collect and use data? Let’s begin!
Brainstorm
- What other ways might specific numbers be meaningful to athletes?
- Do you have any numbers that are special to you?
Record your thoughts in a method of your choice. Share your thoughts with a partner, if possible.
Gametime

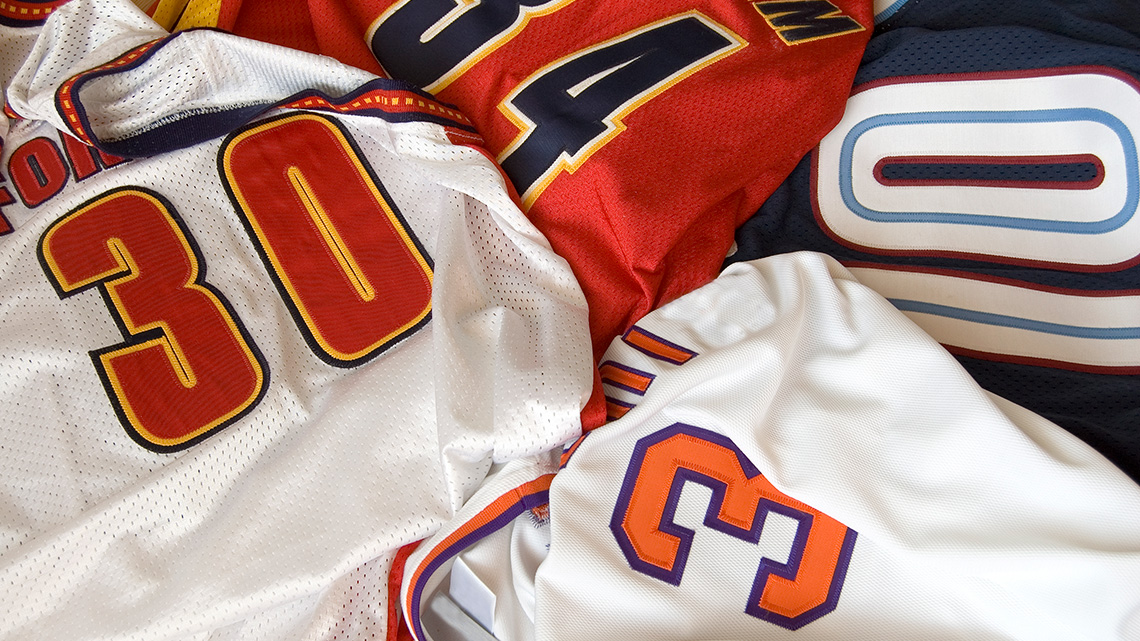
Jerseys

Once a player has chosen their number, they need a team jersey!
The NBA has five different types of jerseys available for teams to use throughout the season. There are no specific jerseys used for home and away games, so teams can choose any from their uniform lineup.
NBA jerseys
Explore the following images and descriptions to learn more about the five different jerseys in the NBA.
Sources:
NBA Properties, Inc. (n.d.). All NBA Uniforms By Edition - Association Edition. NBA Lockervision. https://lockervision.nba.com/edition/association-edition
NBA Properties, Inc. (n.d.). All NBA Uniforms By Edition - City Edition. NBA Lockervision. https://lockervision.nba.com/edition/city-edition
NBA Properties, Inc. (n.d.). All NBA Uniforms By Edition - Classic Edition. NBA Lockervision. https://lockervision.nba.com/edition/classic-edition
NBA Properties, Inc. (n.d.). All NBA Uniforms By Edition - Icon Edition. NBA Lockervision. https://lockervision.nba.com/edition/icon-edition
NBA Properties, Inc. (n.d.). All NBA Uniforms By Edition - Statement Edition. NBA Lockervision. https://lockervision.nba.com/edition/statement-edition
Take a moment and think about what you’ve learned so far!
Data
When it’s time to order jerseys, it’s important to collect the correct data before placing an order.
Data can share all kinds of information. We can track data, organize it, and represent it in different ways.
In the NBA, data helps to support many decisions and actions on and off the court.
Data can include:
- player stats
- information gathered by wearable devices (i.e. tracking player health and performance during a game)
- overall points scored by teams in the regular and playoff season
- how fans engage in-person and online
Source:
Phalkey, M. (2023, May 23). 7 Ways NBA Teams Use Analytics for Performance Improvement. AlmaBetter. https://www.almabetter.com/bytes/articles/how-nba-teams-use-data-analytics-to-improve-their-performance
Fun fact
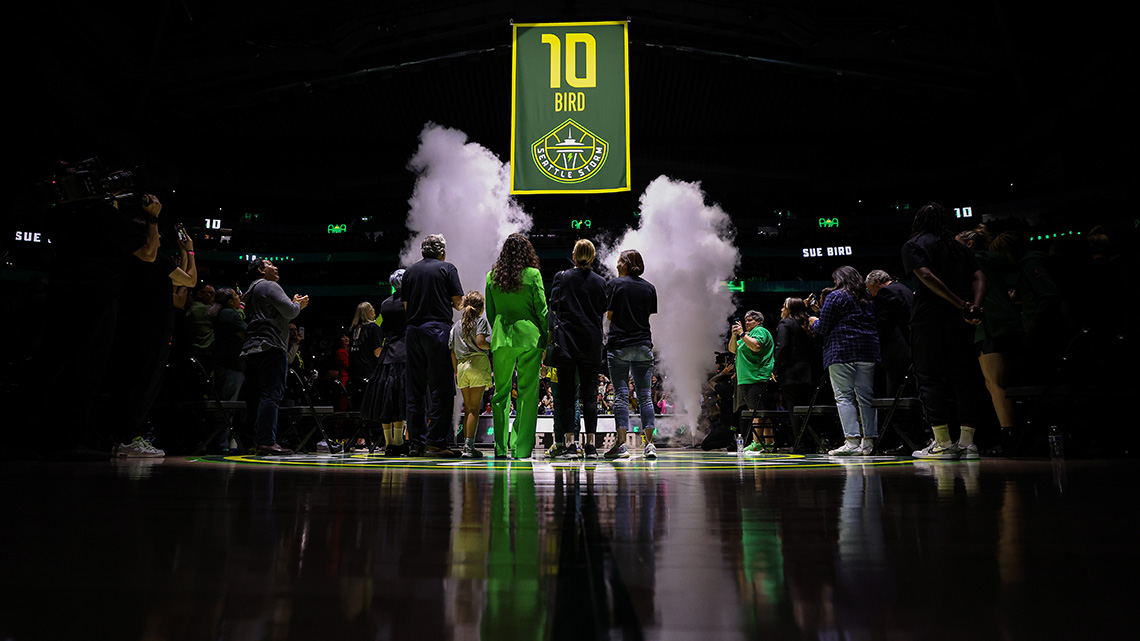
Sue Bird’s jersey retirement ceremony after a game between the Seattle Storm and the Washington Mystics at Climate Pledge Arena on June 11, 2023, in Seattle, Washington. She had played in 550 games over the course of her career with the WNBA.
There are nearly 200 retired numbers in the NBA!
Having a number retired is one of the greatest honours that an NBA player can receive. Once a number has been retired it can never be worn by another player. Some teams will retire certain jersey numbers to honour or remember a special player.
How many jerseys?
Our mascot has been given a list of items to help their team’s Equipment Manager.
First, they need to order City Edition, Association Edition, and Statement Edition jerseys for their team.
They record all the player sizes and have organized this information in a tally chart to use and then store in their files for later orders. Each team roster is made up of 15 players during the season.
Press Equipment Manager to learn more about this role.
An equipment manager is responsible for making sure that their team has all the equipment they need to play and practise. Some of their responsibilities might include:
- managing an equipment budget
- creating contracts with equipment suppliers
- placing orders when needed
- making sure that all equipment is properly maintained
Tally chart
Check out the following tally chart for the players’ jerseys and their sizes.
| Players’ Jersey Order Tally Chart | ||
|---|---|---|
| Size | Tally | Tally total |
| Extra small (XS) | 3 | |
| Small (S) | 6 | |
| Medium (M) | 9 | |
| Large (L) | 15 | |
| Extra large (XL) | 6 | |
| Extra extra large (2XL) | 6 | |
Bar graph
Reminder: We can also share information or data using a bar graph.
Bar graphs include:

Let’s analyze the Equipment Manager’s data in a bar graph.

Bar graph titled, Players’ Jersey Order. The x-axis is labelled, Basketball jersey size, and the y-axis is labelled, Total number of jerseys. The graph’s scale is: 0, 3, 6, 9, 12, 15, 18, 21. The size categories are: 3 extra small, 6 small, 9 medium, 15 large, 6 extra large, and 6 extra extra large.
After exploring the data in a bar graph, reflect on the following:
- What is the most common size that is worn by the basketball players on the mascot’s team?
- What is the difference between the number of players that wear small jerseys and extra-large jerseys?
Mean, median, and mode
A different way to analyze data is to determine the mean, median, and mode.
Press the following tabs to explore mean, median, and mode.
The mean is the average of a set of numbers.
The mean is calculated by adding up all the numbers in the set of data and then dividing that sum by the total number of numbers in the set.
For example, let’s calculate the mean of 10, 20, and 60.
Check out the following table to explore step-by-step instructions on calculating the mean.
| Equation | Instructions |
|---|---|
| 10 + 20 + 60 = 90 |
First, we add all the numbers in the set. So, the sum is 90. |
| 90 ÷ 3 = 30 |
Next, we divide that sum by the total number of numbers in the set. Our sum is 90. Since there were three numbers (10, 20, and 60), we will divide the sum by three. |
| Mean = 30 |
Therefore, the mean or average is 30. The mean is also called the average. |
The median is the middle value of an ordered list.
Check out the following tables to explore each data set and their median.
| Data set A | Calculations |
|---|---|
| 7, 9, 14, 21, 39 | For example, 14 is the median for this set of numbers. |
| Data set B | Calculations |
|---|---|
| 7, 9, 14, 21 |
If there is an even number of data values, then the median is the mean, or average, of the two middle values. So, the two middle values are 9 and 14. Let’s calculate the mean, by first adding the two numbers: 9 + 14 = 25 Then, divide the sum by two: 25 ÷ 2 = 11.5 Therefore, the median of this data set is 11.5. |
The mode refers to an item or number that appears the most in a set of data.
Check out the following data set to explore the mode:

For example, in this data set, the mode is 5.

Try it!
The next item on our mascot’s list is to order the same style of shoe for each player on the team for one of their away games. This will help to unite the team’s overall appearance at the game.
The team’s shoes sizes are:
9, 9, 10, 10, 12, 12, 12, 13, 14, 14, 14, 15, 16, 16, 17
Let’s help the mascot with the following:
- What is the average shoe size (mean)?
- What is the middle shoe size (median)?
- What is the most common shoe size (mode)?
Record your responses and show your work using a method of your choice.
When you’re ready, press Let’s Check! to access the correct answers.
Our data set is:
9, 9, 10, 10, 12, 12, 12, 13, 14, 14, 14, 15, 16, 16, 17
Check out the table to explore how the following questions are solved.
| What is the average shoe size (mean)? |
|---|
|
9 + 9 + 10 + 10 + 12 + 12 + 12 + 13 + 14 + 14 + 14 + 15 + 16 + 16 + 17 = 193 So, the sum is 193, and there are 15 numbers in this data set. Let’s calculate the mean by dividing the two numbers: 193 ÷ 15 = 12.86 Therefore, the mean or the average is approximately 12.9. |
| What is the middle shoe size (median)? |
|---|
|
From the data set, the middle value is 13. 
Therefore, the median is 13. |
| What is the most common shoe size (mode)? |
|---|
|
Both 12 and 14 appear three times in the data set. 
Therefore, the modes are 12 and 14. |
Profile
Jamal Murray
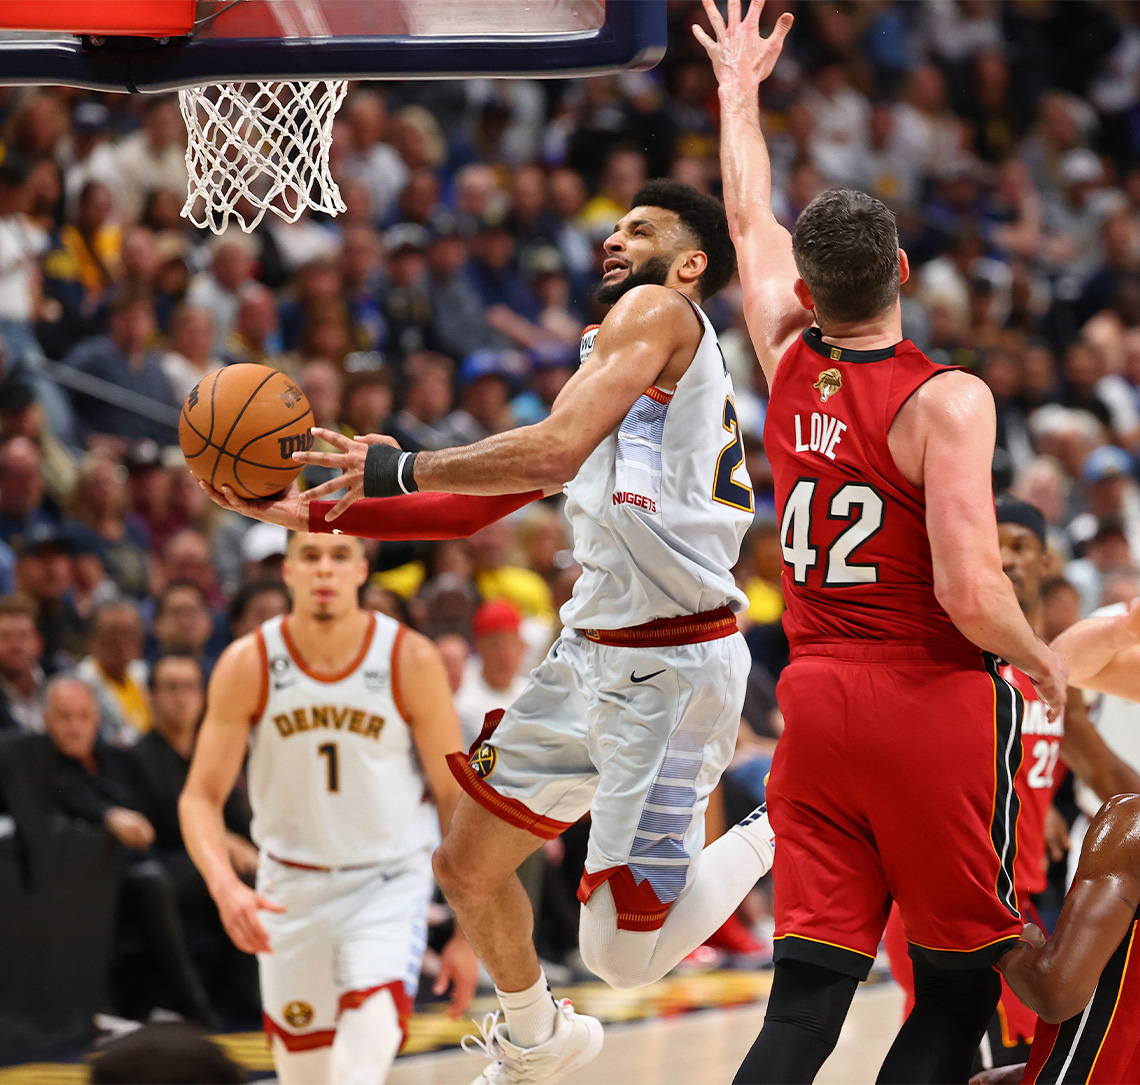
Jamal Murray #27 of the Denver Nuggets (2023) runs towards the net to set up a basket. Kevin Love, #42 of the Miami Heat (2023), reaches an arm up to defend, while Michael Porter Jr., #1 of the Denver Nuggets (2023), runs up from behind.
Jamal Murray is a Canadian basketball player who played for the Denver Nuggets in the 2023 season. He has been playing basketball since he was three years old! Jamal started playing pick up games at 13 against high school and college players.
Since starting with the NBA, he has been named Rising Stars Challenge MVP (2017), Rookie of the Month (Western Conference) in October and November 2016 and he has become the 9th Canadian to win an NBA title with the Denver Nuggets (2023).
Source:
NBA Media Ventures. (n.d.). Jamal Murray: Denver Nuggets. NBA.com. https://www.nba.com/player/1627750/jamal-murray/bio
Fourth Quarter

Exploring data
Our mascot is helping their friend out, who has to put in a shoe order for another team.
They have collected the shoe sizes, and they are:
6, 7, 8, 8, 9, 10, 11, 13
They need to determine:
- the average shoe size in their team (mean)
- the middle shoe size (median)
- the most common shoe size (mode)
Determine the mean, median, and mode and match the numbers to the correct terms.
Using a method of your choice, show your work to prove that the numbers are the mean, median, and mode for the shoe size data.
Pause and reflect
- What other kinds of data might we analyze in everyday life?
- How might finding the mean, median, and mode be useful in different kinds of data sets?
Record your ideas in a method of your choice.
Great job! Think about how you might use the data analysis skills you’ve learned. Catch you next time!